Product Popularity vs Product Profitability: What Amazon Influencers Need to Know
Product popularity vs product profitability: learn how to balance demand and earning potential when choosing products to review.

Amazon can flood your links with clicks. The trick is turning that attention into income you can count on. Popular products win views. Profitable products pay your bills.
This guide shows how to spot the difference, do quick back‑of‑the‑envelope math, and build a product mix that grows both reach and revenue. It also calls out the rules that govern your links and disclosures, so you stay compliant.

TL;DR
Popularity measures demand and attention, while profitability looks at what you actually earn after commissions, returns, and the costs involved in creating or promoting content.
On Amazon, traffic is only part of the equation. Commission potential, conversion, product price, attribution, and returns can all affect what that traffic is worth.
Know your windows. For qualifying off-Amazon Associates links, Amazon’s standard session is 24 hours. Items added to a shopper’s cart during that session may remain eligible if purchased before the cart expires, subject to Amazon’s rules.
Why Popularity and Profitability Are Not the Same
Popularity is about demand and attention signals, such as recent sales activity, views, clicks, product momentum, and creator interest. These tell you what people notice, not what earns. Profitability goes a step further by asking whether the commissions a product generates justify the time and money you put into creating content for it.
For Amazon influencers, useful earning signals include product price, applicable commission opportunities, conversion performance, actual earnings, returns, and the cost of acquiring or reviewing the product. Commission rates vary by product category under Amazon’s published rate card.
Amazon influencers can earn through content shown on Amazon as well as through qualifying off-Amazon Associates links. Because those earnings don't follow exactly the same attribution model, evaluate on-site and off-site performance separately when comparing products.
How Amazon’s Commission Structure Shapes Profit
Standard Amazon Associates commission rates vary by product category, while other earning opportunities, including certain Creator Connections campaigns, can carry different commission rates.
A moderately popular product can therefore generate more commission income than a viral product if its price, commission opportunity, and conversion performance are stronger. Check the current Commission Income Statement for exact categories and rates before you build content around a product.
Conversion timing also matters. The standard Associates cookie is 24 hours from click. If a shopper adds an item to the cart within that window, you generally still earn if they purchase before the cart expires, usually about 90 days. Plan calls to action accordingly.
The Metrics That Actually Move Earnings
Track the right metrics to separate products that attract attention from products that contribute meaningful earnings. When you're comparing what to film or promote next, Viral Vue can help you research product opportunities and review relevant performance data in one workflow.
You can use Viral Vue to compare signals such as product price, commission information, recent revenue indicators, Creator Connections opportunities, and influencer competition, depending on your plan and the tool you use.
Conversion rate: Percentage of your referred visitors who buy. Higher conversion often beats higher traffic.
Average order value (AOV): Total order revenue divided by the number of orders. Higher order values can increase earning potential, but commission rates and qualifying-item rules still matter.
Commission rate: The percentage applied to eligible sales under the applicable Amazon program or opportunity. A higher rate can improve earnings, but only when the product also generates qualifying conversions.
Returns and cancellations: Reversed or canceled orders can reduce earnings. Use your own historical performance data instead of assuming highly reviewed products will necessarily have lower return rates.
Reporting: Associates Central shows clicks, ordered items, shipped items, and conversion rates to guide optimization.
When you're deciding what to feature next, use attention metrics to find opportunities and earnings metrics to decide which opportunities deserve more content. As you research products on Amazon, Viral Vue’s extension can surface relevant product data while you browse, helping you compare opportunities without opening and evaluating every listing one by one.

Popularity vs Profitability: Make the Right Call
Here is a quick way to think about signals that drive attention vs income.
Signal or Lever | Popularity Tells You | Profitability Tells You |
Search volume & social views | Nothing about payout by itself | |
Click-through rate (CTR) | How compelling your creative is | Input to EPC, not the payout itself |
Category commission rate | Does not affect clicks | Directly caps your per‑order earnings |
Conversion rate | Not visible from views alone | Core driver of commissions earned |
Average order value (AOV) | Irrelevant to impressions | Bigger baskets multiply your rate |
Return/out‑of‑stock risk | Rarely visible in trends | Can claw back or suppress earnings |
Cookie window & timing | Does not change views | Dictates whether clicks become paid orders |
A Simple Earning Framework
Start with EPC (earnings per click), which includes total commissions divided by total clicks over the same period. It rolls up category rate, conversion rate, and AOV into one number you can compare across products.
A simplified estimate is EPC ≈ conversion rate × average commission earned per converted order.
When one commission rate applies across the example, you can approximate it as conversion rate × average order value × effective commission rate.
For a simplified hypothetical example, a 3% effective commission rate × 8% conversion × $50 average order value equals about $0.12 in earnings per click.
A second product at 1% × 20% × $120 would produce about $0.24 EPC under the same simplified assumptions, despite potentially attracting less attention.
Where to Find the Data
Use Amazon’s own reports to review clicks, ordered items, shipped items, and conversion data. Then use Viral Vue to add product research, earnings analysis, and ROI context when you are deciding what deserves more of your content budget.
Commission rate: Associates Central’s Commission Income Statement.
Clicks, ordered items, shipped items, conversion rate: Associates Central reports.
Influencer program specifics and onsite earnings: Influencer Program help pages.
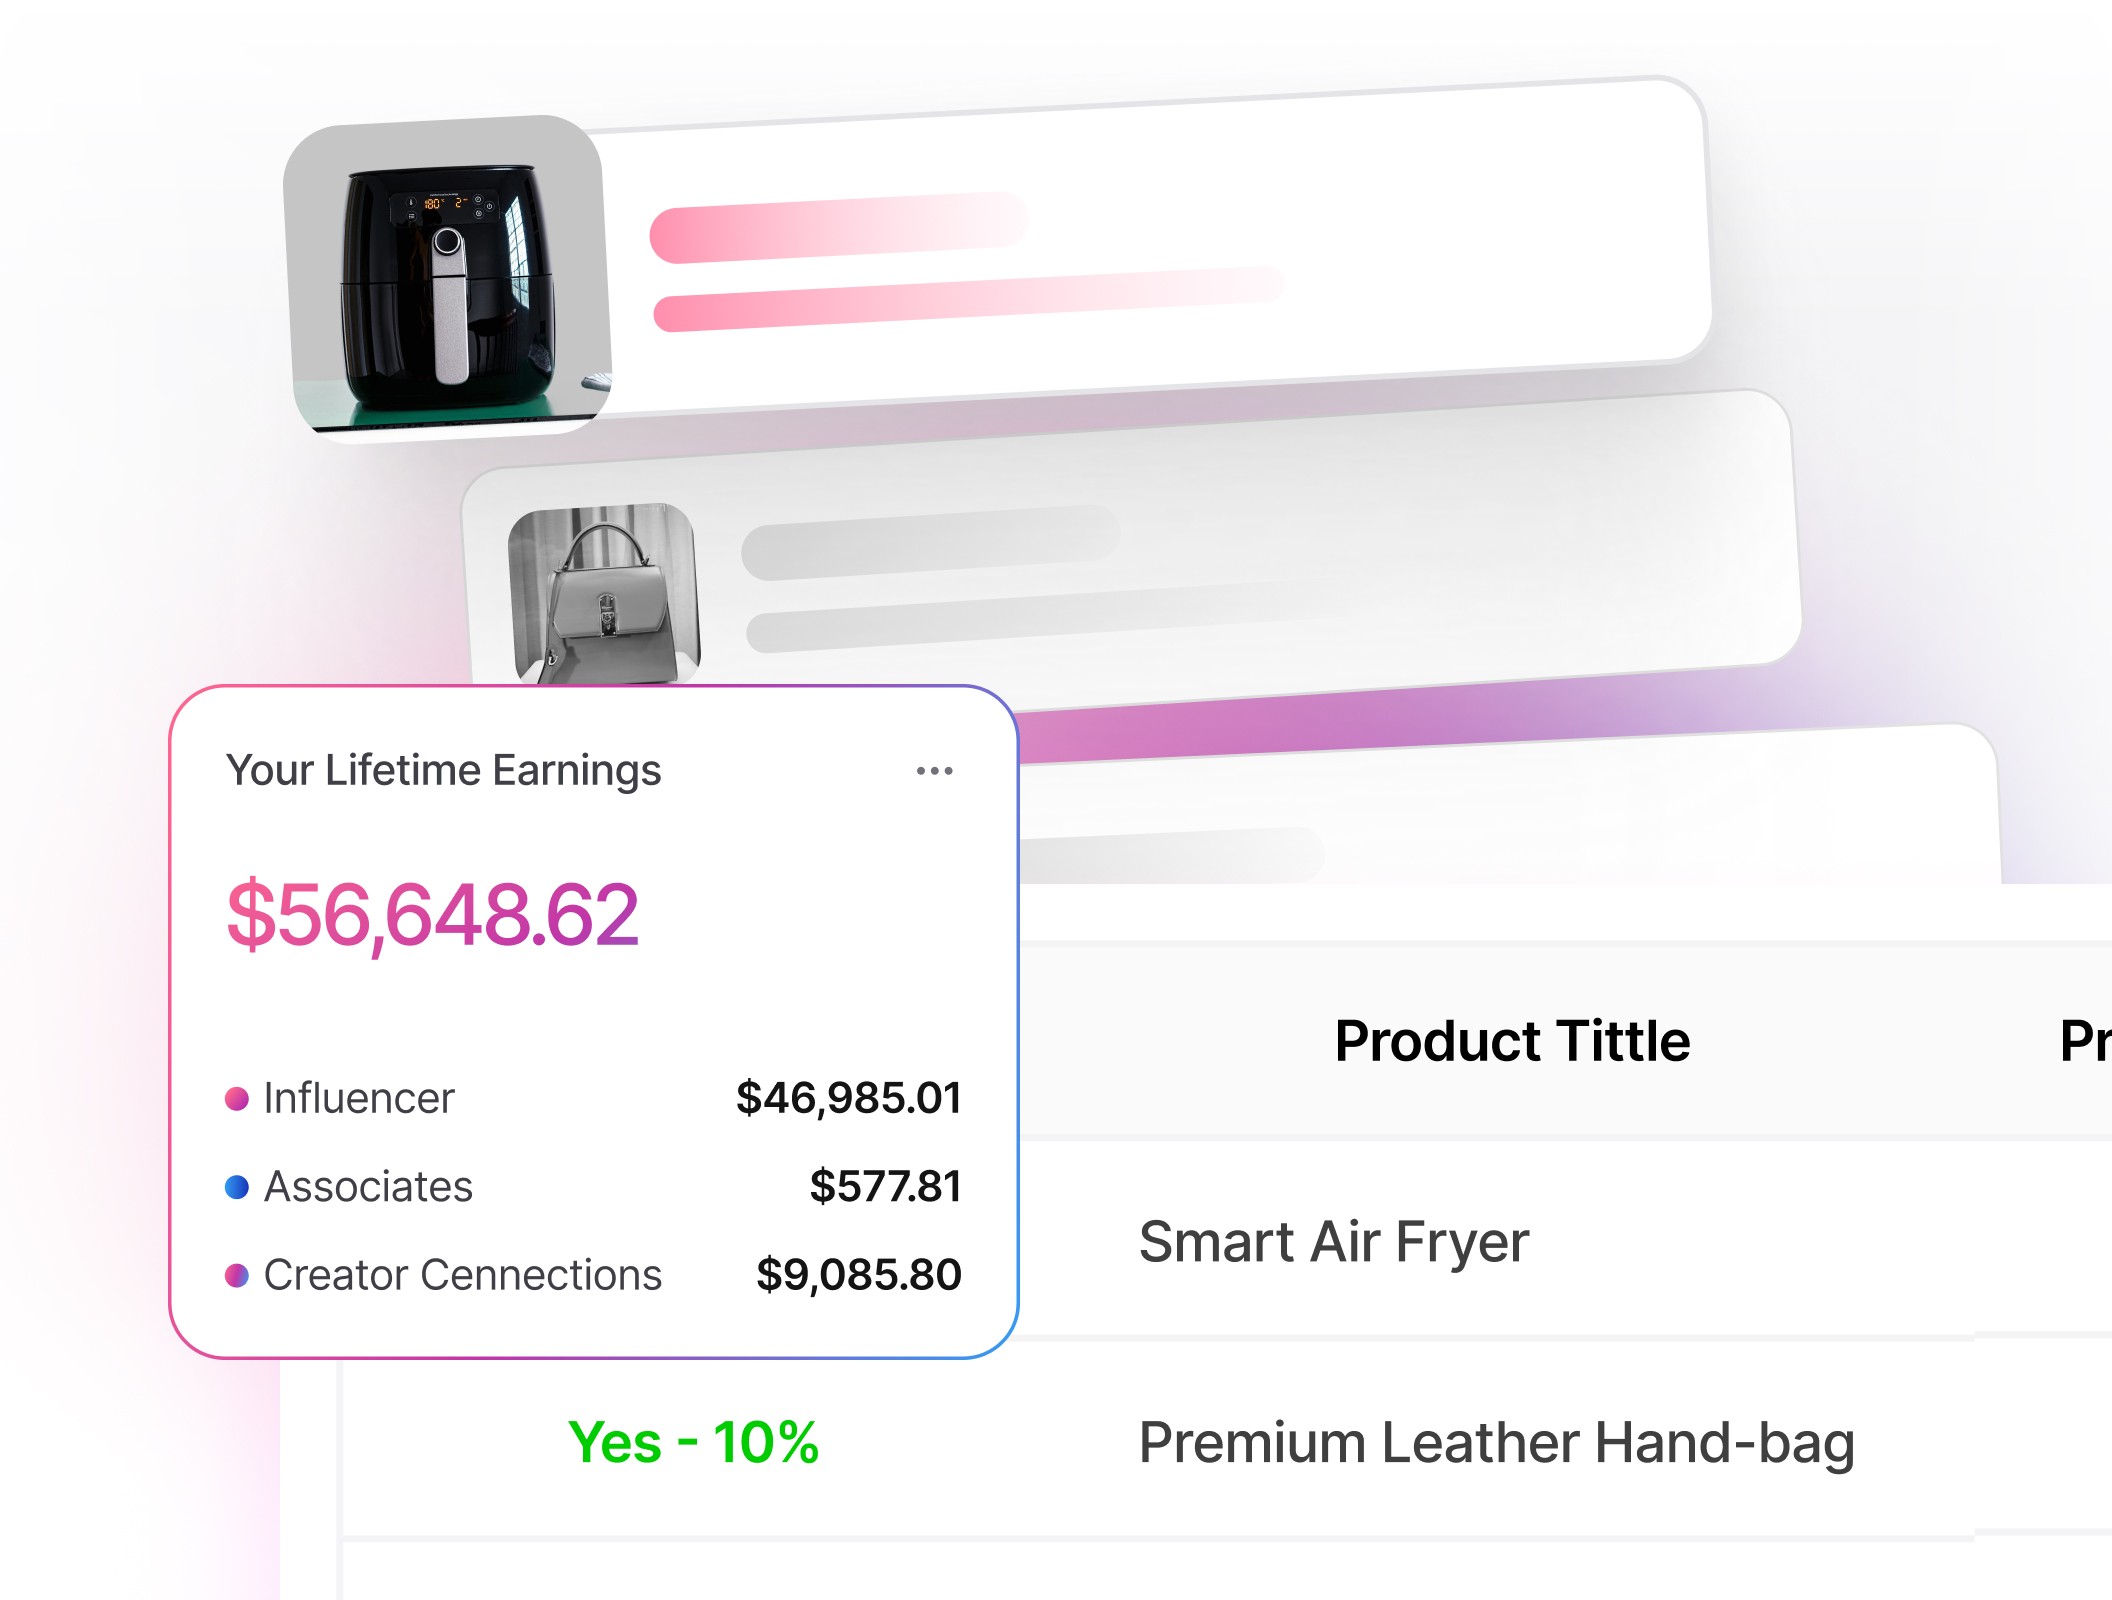
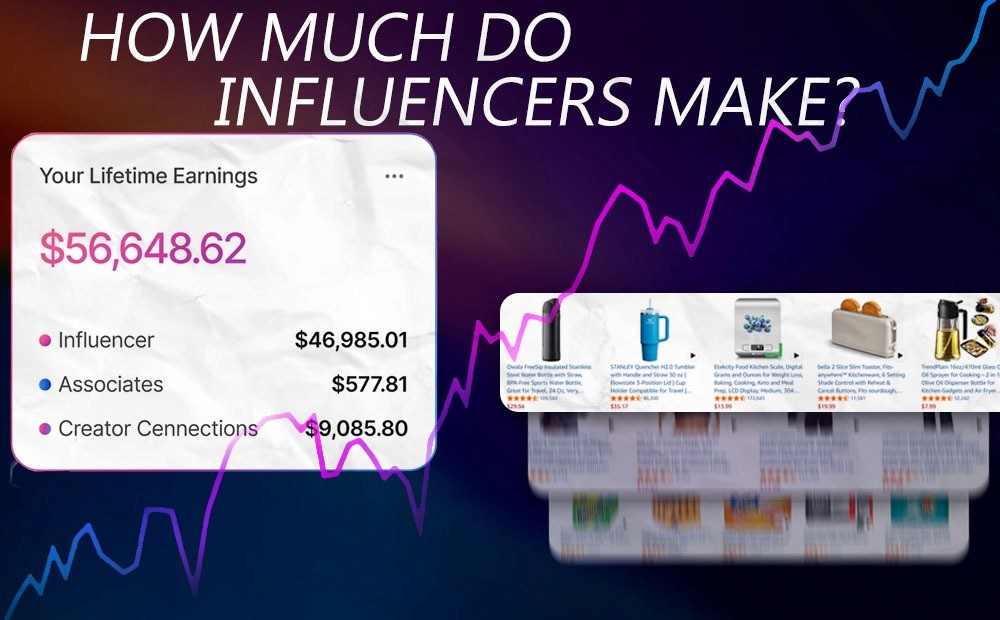
If you use Viral Vue’s Profits Dashboard, you can review onsite, offsite, and Creator Connections earnings in one place. The ROI Tracker can then help you compare those earnings with what you actually spent to acquire products for your content.
Hidden Drains on Profit
Profit can shrink even when a product appears to be performing well. Returns, weak commission opportunities, product costs, and poor conversion can all reduce the value of the time you invested in creating content.
Low‑rate categories: Some categories pay far less than others. Check before you invest time.
Short windows: A 24‑hour cookie rewards content that drives fast decisions. Long‑consideration items can underperform without the cart add.
Returns and cancellations: You're paid after delivery and full payment. High return rates quietly erode earnings.
Product acquisition cost: A product can earn commissions and still produce a weak ROI if you spent heavily to purchase it for review. Track the cost alongside earnings before deciding whether similar products deserve more investment.
Compare what each product has earned with what you actually spent to acquire it. You can use Viral Vue to make that comparison easier by bringing product costs and combined earnings into the same profitability view.
Examples
Going through the following scenarios can help digital creators optimize their content strategy.
A Viral $15 Gadget
A short, catchy reel pushes a $15 kitchen gadget. Views explode, and CTR is great. But the category rate is low, and the AOV stays near $15, so commissions per order are tiny.
Many shoppers browse, then come back days later through another route, missing the 24‑hour window. Net EPC is low even though the product looks popular.
A Higher-Value Home Product
Suppose a $15 kitchen gadget generates strong views and clicks. If its commission per qualifying sale is low or its conversion performance is weak, the resulting earnings may still be modest despite the product’s popularity.
Suppose you create content for an $80 home product with strong commission and conversion potential. It may earn more with fewer views, especially once revenue exceeds your costs. Apply the same approach to your products by comparing attention, earnings, and acquisition costs instead of relying on views alone.
Actionable Steps / Checklist
Use this checklist when deciding what to promote, what to keep testing, and where to shift your content effort.
Confirm category commission rate before filming. Avoid building around chronic low‑rate items unless EPC proves strong.
For off-Amazon Associates content, keep Amazon’s applicable attribution rules in mind when planning calls to action, but avoid creating artificial urgency.
Test higher-value products, complementary items, or existing multipacks when they genuinely fit your audience. Then, compare the resulting earnings rather than assuming a larger basket will always perform better.
If you use Viral Vue’s Profits Dashboard, review those results there to see which products are producing stronger earnings or ROI over time.
Watch conversion rate in Associates Central. Re‑shoot or rewrite low‑converting pieces with clearer demos or FAQs.
Consider availability and product-quality signals, but rely on your actual sales and earnings history when deciding which products deserve another video.
Follow Amazon’s program requirements and FTC disclosure rules separately. For U.S.-facing social content, clearly disclose material brand or affiliate relationships where viewers are likely to notice it.
Rebuild your mix quarterly. Rates and shopper behavior can shift, so re‑check the published rate card and your own EPC.

Glossary
Use these definitions when reviewing your reports or comparing product performance.
AOV (Average Order Value): Total revenue divided by number of orders over the same period.
Commission Rate: The fixed percentage Amazon pays on a sale in a given product category.
Conversion Rate: Percentage of your referred visitors who make a purchase.
Cookie Window: How long after a click a purchase still credits to you; Amazon’s standard window is 24 hours.
EPC (Earnings Per Click): Total commissions divided by total clicks for a link or period.
Onsite Commission Income: Earnings for influencer content used on Amazon’s own site under the Influencer Program.
ROI (Return on Investment): A measure comparing what a product or piece of content earns with what you spent to acquire or produce it. For creators who purchase products for review, ROI can give a clearer profitability picture than commission income alone.
FAQ
Q: Do I really need to use specific disclosure wording?
A: Yes. Amazon requires the statement “As an Amazon Associate, I earn from qualifying purchases” where you use Program Content. Meanwhile, the FTC requires clear, conspicuous disclosures of material connections.
Q: How long do I have to earn after someone clicks my link?
A: The standard window is 24 hours. If the shopper adds an item to their cart during that time, you generally still earn if they purchase before the cart expires, usually about 90 days.
Q: Is a high‑priced item always more profitable?
A: Not necessarily. A lower‑priced item with a higher category rate or better conversion can beat a pricey product on EPC.
Q: Where do I see conversion rate and ordered items?
A: Associates Central reports show clicks, ordered items, shipped items, and conversion rates, with data updated several times daily.
Q: What is the Amazon Influencer Program?
A: The Amazon Influencer Program gives you a customizable storefront and the ability to earn in a similar fashion to Associates, with additional onsite opportunities for eligible creators.
Final Thoughts
A popular product can be worth testing, but attention alone doesn't tell you whether it deserves more of your time or budget. Compare demand with commission potential, actual earnings, and the cost of creating the content before deciding what to prioritize. Tools for Amazon affiliates can help you look beyond popularity and focus on products with stronger commission potential.
Use product research to decide what deserves a test, then use actual earnings and ROI to decide what deserves more of your time. Viral Vue can support both stages: Product Vue helps you compare opportunities before creating content, while the Profits Dashboard helps you evaluate results afterward.



Stop Guessing What to Post Next
Join TikTok Affiliates turning views into consistent commissions.